

Concrete is a nonlinear material, and its behavior under loading cannot be captured by a single universal stress–strain relationship. To account for different strength classes, loading conditions, and levels of analysis, EN 1992‑1‑1 provides three distinct stress–strain models for cross-section design. Each curve reflects a particular way of representing concrete’s response. Understanding these models is essential for engineers, as the choice of curve directly influences the accuracy of structural predictions.
The Parabola-Rectangle Model (Section 3.1.7(1))
This is the standard stress–strain model for cross‑section analysis in Eurocode 2. It captures concrete’s behavior up to its peak strength with an initial parabolic rise, then transitions seamlessly into a flat horizontal straight line at maximum stress. The shape reflects the way concrete sustains load beyond its peak strain without an immediate drop in strength. Because of its balance between realism and simplicity, this model is widely used in design practice. It simplifies the math for safety checks while keeping a mathematically rigorous shape for traditional calculation tools.
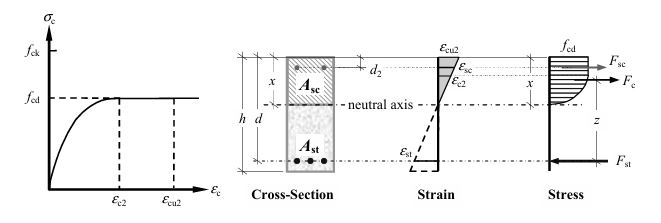
For normal-strength concrete (up to C50/60), the peak strain εc2 is 0.002, and ultimate strain εcu2 is 0.0035, while for high-strength concrete εc2 is 0.0022 and εcu2 is 0.0028. The mathematical model is given below:
for the parabolic rise:
$$
\sigma_c=f_{c d}\left[1-\left(1-\frac{\varepsilon_c}{\varepsilon_{c 2}}\right)^n\right]
$$
For the horizontal plateau
$$
\sigma_c=f_{c d}
$$
Where:
– n is the exponent. $\mathrm{n}=2.0$ for concrete classes up to C50/60, scaling down for higher-strength grades according to Table 3.1 of EN 1992-1-1 using
$$
\mathrm{n}=1.4+23.4[90-f c k / 100]^4
$$
– $\sigma_c$ is the compressive stress.
– $\varepsilon_c$ is the compressive strain.
– $f_{c d}$ is the design value of concrete compressive strength.
– $\varepsilon_{c 2}$ is the strain at peak stress (varies from 0.002 to 0.0022 ).
– $\varepsilon_{c u 2}$ is the ultimate compressive strain (ranges from 0.0035 for grades $\leq \mathrm{C} 50 / 60$ to 0.0028 for high-strength concrete).
The Bilinear Model (Section 3.1.7(2))
This model is a simplified two‑segment line model used for approximate section analysis. It provides a middle ground between the parabola-rectangle and the rectangular block. Linear lines are easier to integrate in software algorithm than parabolic curves, and on the other hand, bilinear model are more strain-driven than a plain rectangular assumption.
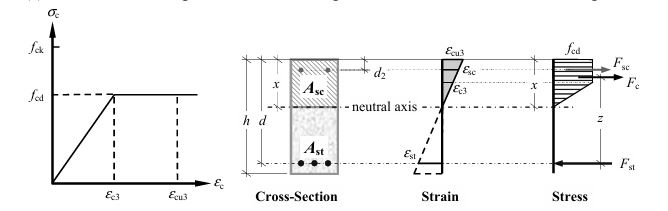
The stress increases linearly from zero up to a strain εc2 which is 0.00175 (0.0023 for high-strength concrete) for normal strength concrete; then the stress remains constant up to the ultimate strain εcu2 of 0.0035 (0.0026 for high-strength concrete).
The Equivalent Rectangular Stress Block (Section 3.1.7(3))
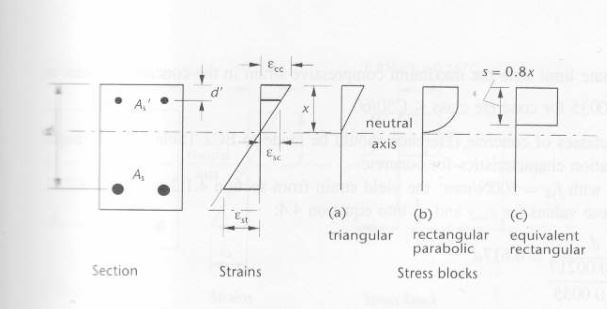
This model is the simplified rectangular stress block where a simple, uniform solid rectangle is used to represent the stress block of the concrete. The stress is assumed to be uniform all over the rectangular region. It allows designers to calculate the concrete compression force by multiplying stress by area, making It perfect for quick hand calculations and verification in design offices.
It is modelled to completely skip heavy mathematics and calibrated with reduction factors to give the exact same safety capacity as the parabola-rectangle model. It uses an effective strength factor η and an effective compression zone depth factor λ. For concrete up to C50/60, the stress is taken as 1.0 x (i.e.: η = 1) over an effective depth of 0.8 times neutral axis depth (x). As for high-strength concrete (where 50MPa ≤ fck ≤ 90MPa), the two factors are to be determines as described below:
η = 1.0 – ( fck – 50)/400
λ = 0.8 – ( fck – 50)/400

Definition of Symbols in the diagrams
λ is a factor defining the effective height of the compression zone
η is a factor defining the compressive strength
x is the neutral axis depth,
z is the lever-arm between the concrete compressive force and steel tensile force,
Ast is the cross-sectional area of tension reinforcement,
Asc is the cross-sectional area of compression reinforcement,
Fsc, Fst and Fc are the forces in the compression steel, tension steel and in compression in the concrete respectively.